Setting up Colorbar Colors Using R and ggplot2
This is an example to set up colors in the colorbars in ggplot2.
Let’s start with generating some random data.
# create a 10-by-10 matrix with random numbers as entries
m = matrix(data = rnorm(n = 100), nrow = 10, ncol = 10)

# converting the matrix into a data frame for ggplot to read
library(reshape2)
df = melt(m)

# showing the first 7 rows of the data frame for illustration
head(x = df, n = 7)
##   Var1 Var2      value
## 1    1    1 -0.2921716
## 2    2    1 -0.6998522
## 3    3    1  1.2001914
## 4    4    1  0.8193078
## 5    5    1 -0.5572283
## 6    6    1 -0.7793558
## 7    7    1 -0.5819304
Time to play with ggplot colorbars (#nofun).
library(ggplot2)  # for plotting
library(cowplot)  # for publication friendly ggplot themes

# setting up the base plot
g = ggplot(data = df, mapping = aes(x = Var1, y = Var2)) + theme_cowplot()

g
Showing our data on the plot as a heatmap colors depending on “value”.
# adding "heatmap" using rastered grids
g1 = g + geom_raster(mapping = aes(fill = value)) # for raster plot, "fill" defines the color inside each rectangle
g1
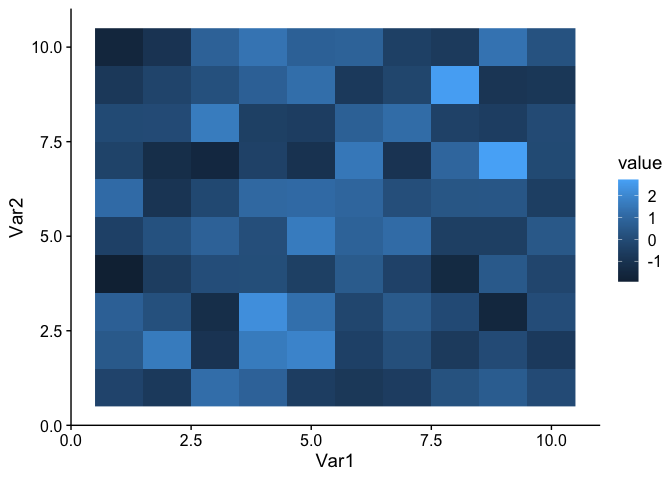
It looks good. Gridboxes with lower values are filled with darker blue, vice versa. But, people want better. For example, some prefer nicer colors.
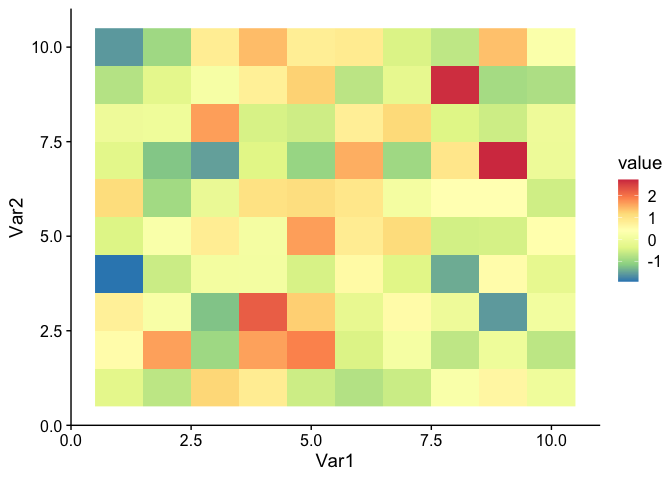
# adding raster but with better colors
g2 = g1 + scale_fill_distiller(palette = "Spectral")
g2
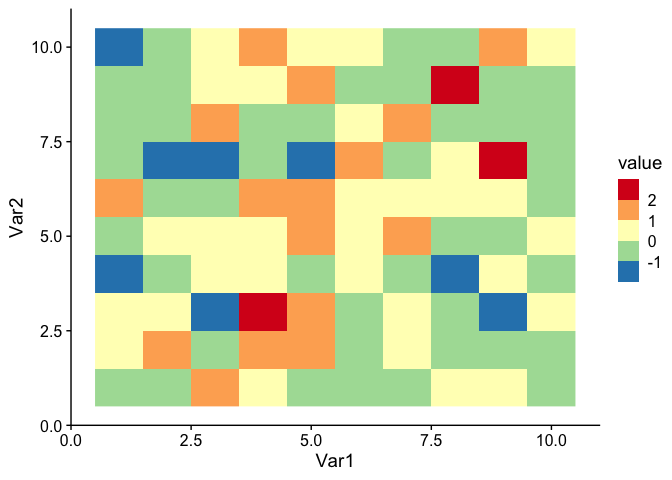
Some prefer binned colors.
# adding raster but with binned colors
g2.binned = g1 + scale_fill_fermenter(palette = "Spectral")
g2.binned
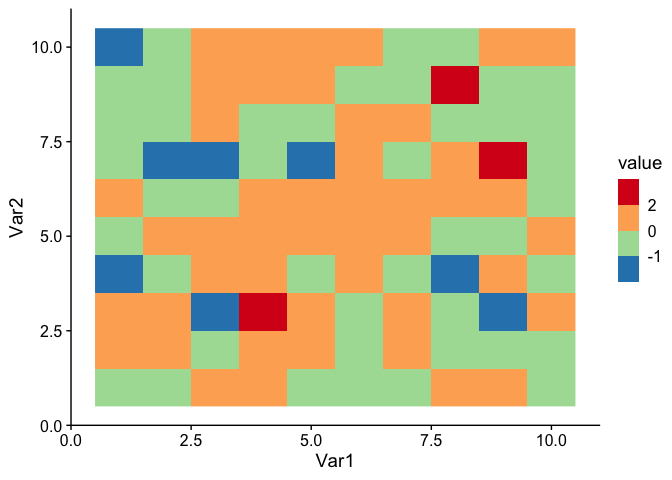
Some prefer binned colors with non-uniform breaks.
# adding raster but with binned colors and customerized breaks
g3 = g1 + scale_fill_fermenter(palette = "Spectral", breaks = c(-1, 0, 2))
g3
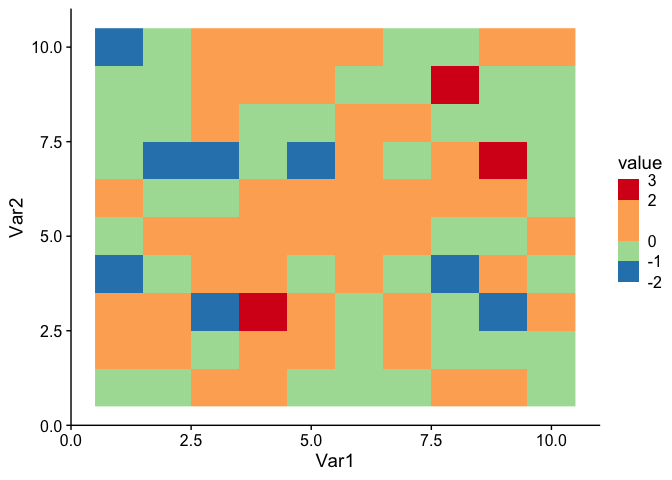
Some even prefer non-uniform scales.
# adding raster but with binned colors and customerized breaks on a non-uniform scale
g4 = g1 + scale_fill_fermenter(palette = "Spectral", breaks = c(-1, 0, 2)) + guides (fill = guide_coloursteps(even.steps = F))
g4

Finally, for some who want to control the limits or ends of the colorbar. One thing to note: after setting the limit range for the colorbar, some gridboxes may have out-of-bound (oob) values and to be treated as “NA”. This can be simply avoid by using the “squish” function under package “scales”.
# adding raster with binned colors and customerized breaks on a non-uniform scale, and control the limits
library(scales)   # for the "squish" function
g5 = g1 + scale_fill_fermenter(palette = "Spectral", breaks = c(-1, 0, 2), limits = c(-2, 3), oob = squish) + guides (fill = guide_coloursteps(even.steps = F, show.limits = T))
g5
Ka Ming FUNG
Data Scientist
Data Scientist who’s interested in the interactions between food security, air pollution, environmental health, and climate change