Scaling a Subset of Input Data in NetCDF Format
Reference: For general python handling of nc files using Xarray: http://xarray.pydata.org/en/stable/index.html
I am working on a set of input data of Ocean DMS concentration. I suspect the reported values over the Southern Ocean (vaguely defined as ocean south to 30ºS) is a bit high. I want to reduce those values by 50% to see if my model will match observations better.
Surprisingly, I didn’t find a quick way to do it. Here I present a work-a-round. (Please let me know if you have a smarter way.)
import wget                        # for downloading data via URL links
import xarray as xr                   # the major tool to work with NetCDF data!
from matplotlib import pyplot as plt  # for plotting
Open the monthly Ocean DMS nc file
The marine DMS data used in this example can be downloaded here. Or, we can download it from Python.
wget.download('http://rain.ucis.dal.ca/ctm/HEMCO/DMS/v2015-07/DMS_lana.geos.1x1.nc')
'DMS_lana.geos.1x1.nc'
We will use the function xr.open_dataset from the xarray package.
ds = xr.open_dataset('DMS_lana.geos.1x1.nc')

ds # display the dataset
<xarray.Dataset>
Dimensions:    (lat: 181, lon: 360, time: 12)
Coordinates:
- lon (lon) float32 -180.0 -179.0 -178.0 -177.0 … 177.0 178.0 179.0
- lat (lat) float32 -89.75 -89.0 -88.0 -87.0 … 87.0 88.0 89.0 89.75
- time (time) datetime64[ns] 1985-01-01 1985-02-01 … 1985-12-01
Data variables:
DMS_OCEAN (time, lat, lon) float32 …
Attributes:
CDI: Climate Data Interface version 1.6.4 (http://code.zmaw.de/p...
Conventions: COARDS
history: Mon Jul 20 16:29:35 2015: ncatted -O -a units,DMS_OCEAN,o,c…
Title: COARDS/netCDF file created by BPCH2COARDS (GAMAP v2-17+)
Format: NetCDF-3
Model: GEOS5_47L
Delta_Lon: 1.0
Delta_Lat: 1.0
NLayers: 47
Start_Date: 19850101
Start_Time: 0
End_Date: 19850201
End_Time: 0
Delta_Time: 744
CDO: Climate Data Operators version 1.6.4 (http://code.zmaw.de/p...xarray.Dataset
- lat: 181
- lon: 360
- time: 12
- lon(lon)float32-180.0 -179.0 … 178.0 179.0
- standard_name :
- longitude
- long_name :
- Longitude
- units :
- degrees_east
- axis :
- X
array([-180., -179., -178., …, 177., 178., 179.], dtype=float32)
- lat(lat)float32-89.75 -89.0 -88.0 … 89.0 89.75
- standard_name :
- latitude
- long_name :
- Latitude
- units :
- degrees_north
- axis :
- Y
array([-89.75, -89.  , -88.  , -87.  , -86.  , -85.  , -84.  , -83.  , -82.  ,
-81.  , -80.  , -79.  , -78.  , -77.  , -76.  , -75.  , -74.  , -73.  ,
-72.  , -71.  , -70.  , -69.  , -68.  , -67.  , -66.  , -65.  , -64.  ,
-63.  , -62.  , -61.  , -60.  , -59.  , -58.  , -57.  , -56.  , -55.  ,
-54.  , -53.  , -52.  , -51.  , -50.  , -49.  , -48.  , -47.  , -46.  ,
-45.  , -44.  , -43.  , -42.  , -41.  , -40.  , -39.  , -38.  , -37.  ,
-36.  , -35.  , -34.  , -33.  , -32.  , -31.  , -30.  , -29.  , -28.  ,
-27.  , -26.  , -25.  , -24.  , -23.  , -22.  , -21.  , -20.  , -19.  ,
-18.  , -17.  , -16.  , -15.  , -14.  , -13.  , -12.  , -11.  , -10.  ,
-9.  ,  -8.  ,  -7.  ,  -6.  ,  -5.  ,  -4.  ,  -3.  ,  -2.  ,  -1.  ,
0.  ,   1.  ,   2.  ,   3.  ,   4.  ,   5.  ,   6.  ,   7.  ,   8.  ,
9.  ,  10.  ,  11.  ,  12.  ,  13.  ,  14.  ,  15.  ,  16.  ,  17.  ,
18.  ,  19.  ,  20.  ,  21.  ,  22.  ,  23.  ,  24.  ,  25.  ,  26.  ,
27.  ,  28.  ,  29.  ,  30.  ,  31.  ,  32.  ,  33.  ,  34.  ,  35.  ,
36.  ,  37.  ,  38.  ,  39.  ,  40.  ,  41.  ,  42.  ,  43.  ,  44.  ,
45.  ,  46.  ,  47.  ,  48.  ,  49.  ,  50.  ,  51.  ,  52.  ,  53.  ,
54.  ,  55.  ,  56.  ,  57.  ,  58.  ,  59.  ,  60.  ,  61.  ,  62.  ,
63.  ,  64.  ,  65.  ,  66.  ,  67.  ,  68.  ,  69.  ,  70.  ,  71.  ,
72.  ,  73.  ,  74.  ,  75.  ,  76.  ,  77.  ,  78.  ,  79.  ,  80.  ,
81.  ,  82.  ,  83.  ,  84.  ,  85.  ,  86.  ,  87.  ,  88.  ,  89.  ,
89.75], dtype=float32)
- time(time)datetime64[ns]1985-01-01 … 1985-12-01
- standard_name :
- time
- long_name :
- Time
array(['1985-01-01T00:00:00.000000000', '1985-02-01T00:00:00.000000000',
'1985-03-01T00:00:00.000000000', '1985-04-01T00:00:00.000000000',
'1985-05-01T00:00:00.000000000', '1985-06-01T00:00:00.000000000',
'1985-07-01T00:00:00.000000000', '1985-08-01T00:00:00.000000000',
'1985-09-01T00:00:00.000000000', '1985-10-01T00:00:00.000000000',
'1985-11-01T00:00:00.000000000', '1985-12-01T00:00:00.000000000'],
dtype='datetime64[ns]')
- DMS_OCEAN(time, lat, lon)float32…
- long_name :
- Ocean DMS concentration
- units :
- kg/m3
[781920 values with dtype=float32]
- CDI :
- Climate Data Interface version 1.6.4 (http://code.zmaw.de/projects/cdi)
- Conventions :
- COARDS
- history :
- Mon Jul 20 16:29:35 2015: ncatted -O -a units,DMS_OCEAN,o,c,kg/m3 tmp3.nc Mon Jul 20 16:29:34 2015: cdo mulc,6.213e-8 tmp2.nc tmp3.nc Mon Jul 20 16:29:34 2015: cdo chname,BIOGSRCE__DMSOCN,DMS_OCEAN tmp.nc tmp2.nc Mon Jul 20 16:29:34 2015: cdo mergetime tmp.1985*.nc tmp.nc
- Title :
- COARDS/netCDF file created by BPCH2COARDS (GAMAP v2-17+)
- Format :
- NetCDF-3
- Model :
- GEOS5_47L
- Delta_Lon :
- 1.0
- Delta_Lat :
- 1.0
- NLayers :
- 47
- Start_Date :
- 19850101
- Start_Time :
- 0
- End_Date :
- 19850201
- End_Time :
- 0
- Delta_Time :
- 744
- CDO :
- Climate Data Operators version 1.6.4 (http://code.zmaw.de/projects/cdo)
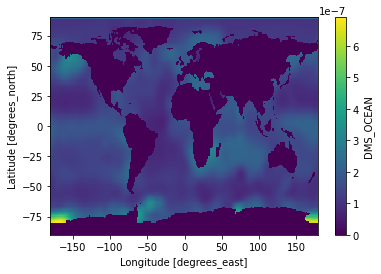
We can also visualize annual mean of the data for a quick check:
ds['DMS_OCEAN'].mean(dim=['time']).plot()
<matplotlib.collections.QuadMesh at 0x7fd61bbd01f0>
Scaling down the Southern Ocean DMS
As mentioned, we want to scale down the ocean DMS below 30ºS.
# Step 1: make two copies of the data set, one for grid cells with lat > 30ºS, one for <30ºS

dms_above30S = ds['DMS_OCEAN'].sel(lat=slice(-30,90))

dms_below30S = ds['DMS_OCEAN'].sel(lat=slice(-90,-30-1e-9)) # we add a small value here to avoid the grid cells with lat = 30ºS to appear in both data sets.

# Step 2: reduce the DMS in the dataset of interest by 50%

dms_below30S = dms_below30S * 0.5

# Step 3: merge the untouched and scaled data
ds_partly_scaled = xr.merge([dms_below30S, dms_above30S], compat="no_conflicts")
To ensure our exercise is correct, let’s make some plots to compare the DMS concentrations in ds_partly_scaled and the original dataset, ds.
(ds_partly_scaled['DMS_OCEAN'] / ds['DMS_OCEAN']).plot(col='time', col_wrap=3)
<xarray.plot.facetgrid.FacetGrid at 0x7fd61bd3ba00>
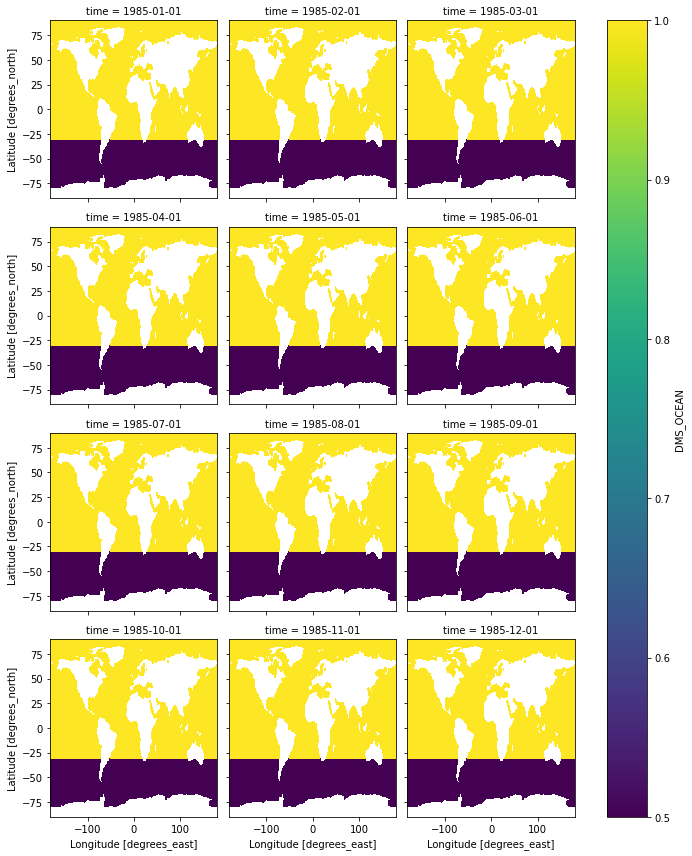
Yellow = 1 (untouched); Purple = 0.5(scaled). Mission accomplished?
ds_partly_scaled # missing attributes from the original dataset.
<xarray.Dataset>
Dimensions:    (lat: 181, lon: 360, time: 12)
Coordinates:
-
lat (lat) float64 -89.75 -89.0 -88.0 -87.0 … 87.0 88.0 89.0 89.75
-
lon (lon) float32 -180.0 -179.0 -178.0 -177.0 … 177.0 178.0 179.0
-
time (time) datetime64[ns] 1985-01-01 1985-02-01 … 1985-12-01 Data variables: DMS_OCEAN (time, lat, lon) float32 0.0 0.0 … 1.4103641e-07 1.4103641e-07
xarray.Dataset- lat: 181
- lon: 360
- time: 12
- lat(lat)float64-89.75 -89.0 -88.0 … 89.0 89.75
- standard_name :
- latitude
- long_name :
- Latitude
- units :
- degrees_north
- axis :
- Y
array([-89.75, -89.  , -88.  , -87.  , -86.  , -85.  , -84.  , -83.  , -82.  ,
-81.  , -80.  , -79.  , -78.  , -77.  , -76.  , -75.  , -74.  , -73.  ,
-72.  , -71.  , -70.  , -69.  , -68.  , -67.  , -66.  , -65.  , -64.  ,
-63.  , -62.  , -61.  , -60.  , -59.  , -58.  , -57.  , -56.  , -55.  ,
-54.  , -53.  , -52.  , -51.  , -50.  , -49.  , -48.  , -47.  , -46.  ,
-45.  , -44.  , -43.  , -42.  , -41.  , -40.  , -39.  , -38.  , -37.  ,
-36.  , -35.  , -34.  , -33.  , -32.  , -31.  , -30.  , -29.  , -28.  ,
-27.  , -26.  , -25.  , -24.  , -23.  , -22.  , -21.  , -20.  , -19.  ,
-18.  , -17.  , -16.  , -15.  , -14.  , -13.  , -12.  , -11.  , -10.  ,
-9.  ,  -8.  ,  -7.  ,  -6.  ,  -5.  ,  -4.  ,  -3.  ,  -2.  ,  -1.  ,
0.  ,   1.  ,   2.  ,   3.  ,   4.  ,   5.  ,   6.  ,   7.  ,   8.  ,
9.  ,  10.  ,  11.  ,  12.  ,  13.  ,  14.  ,  15.  ,  16.  ,  17.  ,
18.  ,  19.  ,  20.  ,  21.  ,  22.  ,  23.  ,  24.  ,  25.  ,  26.  ,
27.  ,  28.  ,  29.  ,  30.  ,  31.  ,  32.  ,  33.  ,  34.  ,  35.  ,
36.  ,  37.  ,  38.  ,  39.  ,  40.  ,  41.  ,  42.  ,  43.  ,  44.  ,
45.  ,  46.  ,  47.  ,  48.  ,  49.  ,  50.  ,  51.  ,  52.  ,  53.  ,
54.  ,  55.  ,  56.  ,  57.  ,  58.  ,  59.  ,  60.  ,  61.  ,  62.  ,
63.  ,  64.  ,  65.  ,  66.  ,  67.  ,  68.  ,  69.  ,  70.  ,  71.  ,
72.  ,  73.  ,  74.  ,  75.  ,  76.  ,  77.  ,  78.  ,  79.  ,  80.  ,
81.  ,  82.  ,  83.  ,  84.  ,  85.  ,  86.  ,  87.  ,  88.  ,  89.  ,
89.75])
- lon(lon)float32-180.0 -179.0 … 178.0 179.0
- standard_name :
- longitude
- long_name :
- Longitude
- units :
- degrees_east
- axis :
- X
array([-180., -179., -178., …, 177., 178., 179.], dtype=float32)
- time(time)datetime64[ns]1985-01-01 … 1985-12-01
- standard_name :
- time
- long_name :
- Time
array(['1985-01-01T00:00:00.000000000', '1985-02-01T00:00:00.000000000',
'1985-03-01T00:00:00.000000000', '1985-04-01T00:00:00.000000000',
'1985-05-01T00:00:00.000000000', '1985-06-01T00:00:00.000000000',
'1985-07-01T00:00:00.000000000', '1985-08-01T00:00:00.000000000',
'1985-09-01T00:00:00.000000000', '1985-10-01T00:00:00.000000000',
'1985-11-01T00:00:00.000000000', '1985-12-01T00:00:00.000000000'],
dtype='datetime64[ns]')
- DMS_OCEAN(time, lat, lon)float320.0 0.0 … 1.4103641e-07
array([[[0.0000000e+00, 0.0000000e+00, 0.0000000e+00, …,
0.0000000e+00, 0.0000000e+00, 0.0000000e+00],
[0.0000000e+00, 0.0000000e+00, 0.0000000e+00, …,
0.0000000e+00, 0.0000000e+00, 0.0000000e+00],
[0.0000000e+00, 0.0000000e+00, 0.0000000e+00, …,
0.0000000e+00, 0.0000000e+00, 0.0000000e+00],
…,
[1.0823291e-07, 1.0823291e-07, 1.0823291e-07, …,
1.0823291e-07, 1.0823291e-07, 1.0823291e-07],
[1.0823292e-07, 1.0823292e-07, 1.0823292e-07, …,
1.0823292e-07, 1.0823292e-07, 1.0823292e-07],
[2.1647536e-07, 2.1647536e-07, 2.1647536e-07, …,
2.1647536e-07, 2.1647536e-07, 2.1647536e-07]],
[[0.0000000e+00, 0.0000000e+00, 0.0000000e+00, …,
0.0000000e+00, 0.0000000e+00, 0.0000000e+00],
[0.0000000e+00, 0.0000000e+00, 0.0000000e+00, …,
0.0000000e+00, 0.0000000e+00, 0.0000000e+00],
[0.0000000e+00, 0.0000000e+00, 0.0000000e+00, …,
0.0000000e+00, 0.0000000e+00, 0.0000000e+00],
…
[4.1650505e-08, 4.1650505e-08, 4.1650505e-08, …,
4.1650505e-08, 4.1650505e-08, 4.1650505e-08],
[4.1650505e-08, 4.1650505e-08, 4.1650505e-08, …,
4.1650505e-08, 4.1650505e-08, 4.1650505e-08],
[8.3304677e-08, 8.3304677e-08, 8.3304677e-08, …,
8.3304677e-08, 8.3304677e-08, 8.3304677e-08]],
[[0.0000000e+00, 0.0000000e+00, 0.0000000e+00, …,
0.0000000e+00, 0.0000000e+00, 0.0000000e+00],
[0.0000000e+00, 0.0000000e+00, 0.0000000e+00, …,
0.0000000e+00, 0.0000000e+00, 0.0000000e+00],
[0.0000000e+00, 0.0000000e+00, 0.0000000e+00, …,
0.0000000e+00, 0.0000000e+00, 0.0000000e+00],
…,
[7.0515100e-08, 7.0515100e-08, 7.0515100e-08, …,
7.0515100e-08, 7.0515100e-08, 7.0515100e-08],
[7.0515107e-08, 7.0515107e-08, 7.0515107e-08, …,
7.0515107e-08, 7.0515107e-08, 7.0515107e-08],
[1.4103641e-07, 1.4103641e-07, 1.4103641e-07, …,
1.4103641e-07, 1.4103641e-07, 1.4103641e-07]]], dtype=float32)
Preserving metadata from the original nc file
Not yet! Now the new merged data set is missing the Attributes of the original.
To fix this, we need to make a xarray copy of the original to preserve the original information, but with the new scaled values.
ds_new = ds.copy(data=ds_partly_scaled)

ds_new # now with the Attributes
<xarray.Dataset>
Dimensions:    (lat: 181, lon: 360, time: 12)
Coordinates:
-
lon (lon) float32 -180.0 -179.0 -178.0 -177.0 … 177.0 178.0 179.0
-
lat (lat) float64 -89.75 -89.0 -88.0 -87.0 … 87.0 88.0 89.0 89.75
-
time (time) datetime64[ns] 1985-01-01 1985-02-01 … 1985-12-01 Data variables: DMS_OCEAN (time, lat, lon) float32 0.0 0.0 … 1.4103641e-07 1.4103641e-07 Attributes: CDI: Climate Data Interface version 1.6.4 (http://code.zmaw.de/p... Conventions: COARDS history: Mon Jul 20 16:29:35 2015: ncatted -O -a units,DMS_OCEAN,o,c… Title: COARDS/netCDF file created by BPCH2COARDS (GAMAP v2-17+) Format: NetCDF-3 Model: GEOS5_47L Delta_Lon: 1.0 Delta_Lat: 1.0 NLayers: 47 Start_Date: 19850101 Start_Time: 0 End_Date: 19850201 End_Time: 0 Delta_Time: 744 CDO: Climate Data Operators version 1.6.4 (http://code.zmaw.de/p...
xarray.Dataset- lat: 181
- lon: 360
- time: 12
- lon(lon)float32-180.0 -179.0 … 178.0 179.0
- standard_name :
- longitude
- long_name :
- Longitude
- units :
- degrees_east
- axis :
- X
array([-180., -179., -178., …, 177., 178., 179.], dtype=float32)
- lat(lat)float64-89.75 -89.0 -88.0 … 89.0 89.75
- standard_name :
- latitude
- long_name :
- Latitude
- units :
- degrees_north
- axis :
- Y
array([-89.75, -89.  , -88.  , -87.  , -86.  , -85.  , -84.  , -83.  , -82.  ,
-81.  , -80.  , -79.  , -78.  , -77.  , -76.  , -75.  , -74.  , -73.  ,
-72.  , -71.  , -70.  , -69.  , -68.  , -67.  , -66.  , -65.  , -64.  ,
-63.  , -62.  , -61.  , -60.  , -59.  , -58.  , -57.  , -56.  , -55.  ,
-54.  , -53.  , -52.  , -51.  , -50.  , -49.  , -48.  , -47.  , -46.  ,
-45.  , -44.  , -43.  , -42.  , -41.  , -40.  , -39.  , -38.  , -37.  ,
-36.  , -35.  , -34.  , -33.  , -32.  , -31.  , -30.  , -29.  , -28.  ,
-27.  , -26.  , -25.  , -24.  , -23.  , -22.  , -21.  , -20.  , -19.  ,
-18.  , -17.  , -16.  , -15.  , -14.  , -13.  , -12.  , -11.  , -10.  ,
-9.  ,  -8.  ,  -7.  ,  -6.  ,  -5.  ,  -4.  ,  -3.  ,  -2.  ,  -1.  ,
0.  ,   1.  ,   2.  ,   3.  ,   4.  ,   5.  ,   6.  ,   7.  ,   8.  ,
9.  ,  10.  ,  11.  ,  12.  ,  13.  ,  14.  ,  15.  ,  16.  ,  17.  ,
18.  ,  19.  ,  20.  ,  21.  ,  22.  ,  23.  ,  24.  ,  25.  ,  26.  ,
27.  ,  28.  ,  29.  ,  30.  ,  31.  ,  32.  ,  33.  ,  34.  ,  35.  ,
36.  ,  37.  ,  38.  ,  39.  ,  40.  ,  41.  ,  42.  ,  43.  ,  44.  ,
45.  ,  46.  ,  47.  ,  48.  ,  49.  ,  50.  ,  51.  ,  52.  ,  53.  ,
54.  ,  55.  ,  56.  ,  57.  ,  58.  ,  59.  ,  60.  ,  61.  ,  62.  ,
63.  ,  64.  ,  65.  ,  66.  ,  67.  ,  68.  ,  69.  ,  70.  ,  71.  ,
72.  ,  73.  ,  74.  ,  75.  ,  76.  ,  77.  ,  78.  ,  79.  ,  80.  ,
81.  ,  82.  ,  83.  ,  84.  ,  85.  ,  86.  ,  87.  ,  88.  ,  89.  ,
89.75])
- time(time)datetime64[ns]1985-01-01 … 1985-12-01
- standard_name :
- time
- long_name :
- Time
array(['1985-01-01T00:00:00.000000000', '1985-02-01T00:00:00.000000000',
'1985-03-01T00:00:00.000000000', '1985-04-01T00:00:00.000000000',
'1985-05-01T00:00:00.000000000', '1985-06-01T00:00:00.000000000',
'1985-07-01T00:00:00.000000000', '1985-08-01T00:00:00.000000000',
'1985-09-01T00:00:00.000000000', '1985-10-01T00:00:00.000000000',
'1985-11-01T00:00:00.000000000', '1985-12-01T00:00:00.000000000'],
dtype='datetime64[ns]')
- DMS_OCEAN(time, lat, lon)float320.0 0.0 … 1.4103641e-07
- long_name :
- Ocean DMS concentration
- units :
- kg/m3
array([[[0.0000000e+00, 0.0000000e+00, 0.0000000e+00, …,
0.0000000e+00, 0.0000000e+00, 0.0000000e+00],
[0.0000000e+00, 0.0000000e+00, 0.0000000e+00, …,
0.0000000e+00, 0.0000000e+00, 0.0000000e+00],
[0.0000000e+00, 0.0000000e+00, 0.0000000e+00, …,
0.0000000e+00, 0.0000000e+00, 0.0000000e+00],
…,
[1.0823291e-07, 1.0823291e-07, 1.0823291e-07, …,
1.0823291e-07, 1.0823291e-07, 1.0823291e-07],
[1.0823292e-07, 1.0823292e-07, 1.0823292e-07, …,
1.0823292e-07, 1.0823292e-07, 1.0823292e-07],
[2.1647536e-07, 2.1647536e-07, 2.1647536e-07, …,
2.1647536e-07, 2.1647536e-07, 2.1647536e-07]],
[[0.0000000e+00, 0.0000000e+00, 0.0000000e+00, …,
0.0000000e+00, 0.0000000e+00, 0.0000000e+00],
[0.0000000e+00, 0.0000000e+00, 0.0000000e+00, …,
0.0000000e+00, 0.0000000e+00, 0.0000000e+00],
[0.0000000e+00, 0.0000000e+00, 0.0000000e+00, …,
0.0000000e+00, 0.0000000e+00, 0.0000000e+00],
…
[4.1650505e-08, 4.1650505e-08, 4.1650505e-08, …,
4.1650505e-08, 4.1650505e-08, 4.1650505e-08],
[4.1650505e-08, 4.1650505e-08, 4.1650505e-08, …,
4.1650505e-08, 4.1650505e-08, 4.1650505e-08],
[8.3304677e-08, 8.3304677e-08, 8.3304677e-08, …,
8.3304677e-08, 8.3304677e-08, 8.3304677e-08]],
[[0.0000000e+00, 0.0000000e+00, 0.0000000e+00, …,
0.0000000e+00, 0.0000000e+00, 0.0000000e+00],
[0.0000000e+00, 0.0000000e+00, 0.0000000e+00, …,
0.0000000e+00, 0.0000000e+00, 0.0000000e+00],
[0.0000000e+00, 0.0000000e+00, 0.0000000e+00, …,
0.0000000e+00, 0.0000000e+00, 0.0000000e+00],
…,
[7.0515100e-08, 7.0515100e-08, 7.0515100e-08, …,
7.0515100e-08, 7.0515100e-08, 7.0515100e-08],
[7.0515107e-08, 7.0515107e-08, 7.0515107e-08, …,
7.0515107e-08, 7.0515107e-08, 7.0515107e-08],
[1.4103641e-07, 1.4103641e-07, 1.4103641e-07, …,
1.4103641e-07, 1.4103641e-07, 1.4103641e-07]]], dtype=float32)
- CDI :
- Climate Data Interface version 1.6.4 (http://code.zmaw.de/projects/cdi)
- Conventions :
- COARDS
- history :
- Mon Jul 20 16:29:35 2015: ncatted -O -a units,DMS_OCEAN,o,c,kg/m3 tmp3.nc Mon Jul 20 16:29:34 2015: cdo mulc,6.213e-8 tmp2.nc tmp3.nc Mon Jul 20 16:29:34 2015: cdo chname,BIOGSRCE__DMSOCN,DMS_OCEAN tmp.nc tmp2.nc Mon Jul 20 16:29:34 2015: cdo mergetime tmp.1985*.nc tmp.nc
- Title :
- COARDS/netCDF file created by BPCH2COARDS (GAMAP v2-17+)
- Format :
- NetCDF-3
- Model :
- GEOS5_47L
- Delta_Lon :
- 1.0
- Delta_Lat :
- 1.0
- NLayers :
- 47
- Start_Date :
- 19850101
- Start_Time :
- 0
- End_Date :
- 19850201
- End_Time :
- 0
- Delta_Time :
- 744
- CDO :
- Climate Data Operators version 1.6.4 (http://code.zmaw.de/projects/cdo)
Finally, save the scaled DMS in a new file
And, it’s one-line easy.
ds_new.to_netcdf('DMS_lana.geos.1x1.SouthernHalved.nc') # always good to have a descriptive name
Again, I know that it’s likely not the best way. Please let me know if you have a smarter way. I am always open to learn!
Ka Ming FUNG
Data Scientist
Data Scientist who’s interested in the interactions between food security, air pollution, environmental health, and climate change